Facebook
 X
X
 Pinterest
 Copy Link

The following chart displays the MLS number of sales for 12 months to December 31, 2025 vs. 12 months prior. The HPI prices uncover the trend year-over-year. Yellow denotes a loss in sales and prices.
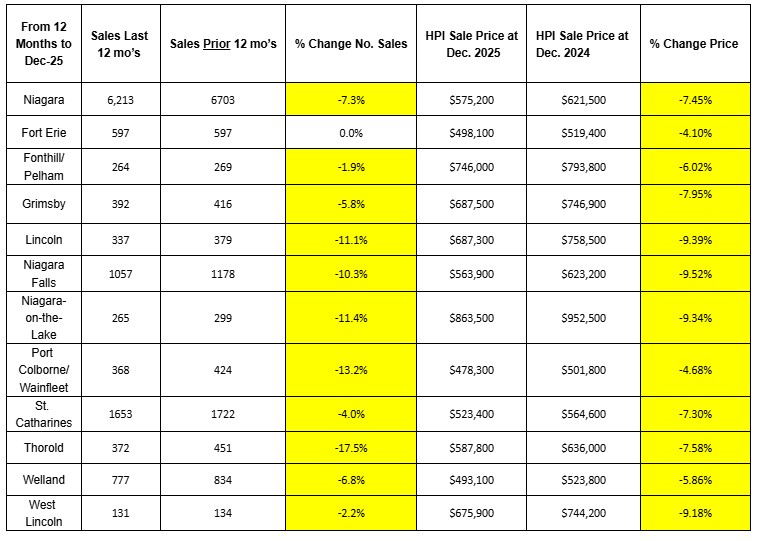
Niagara Region Market Stats — Sales and Prices Year-Over-Year