Facebook
 X
X
 Pinterest
 Copy Link
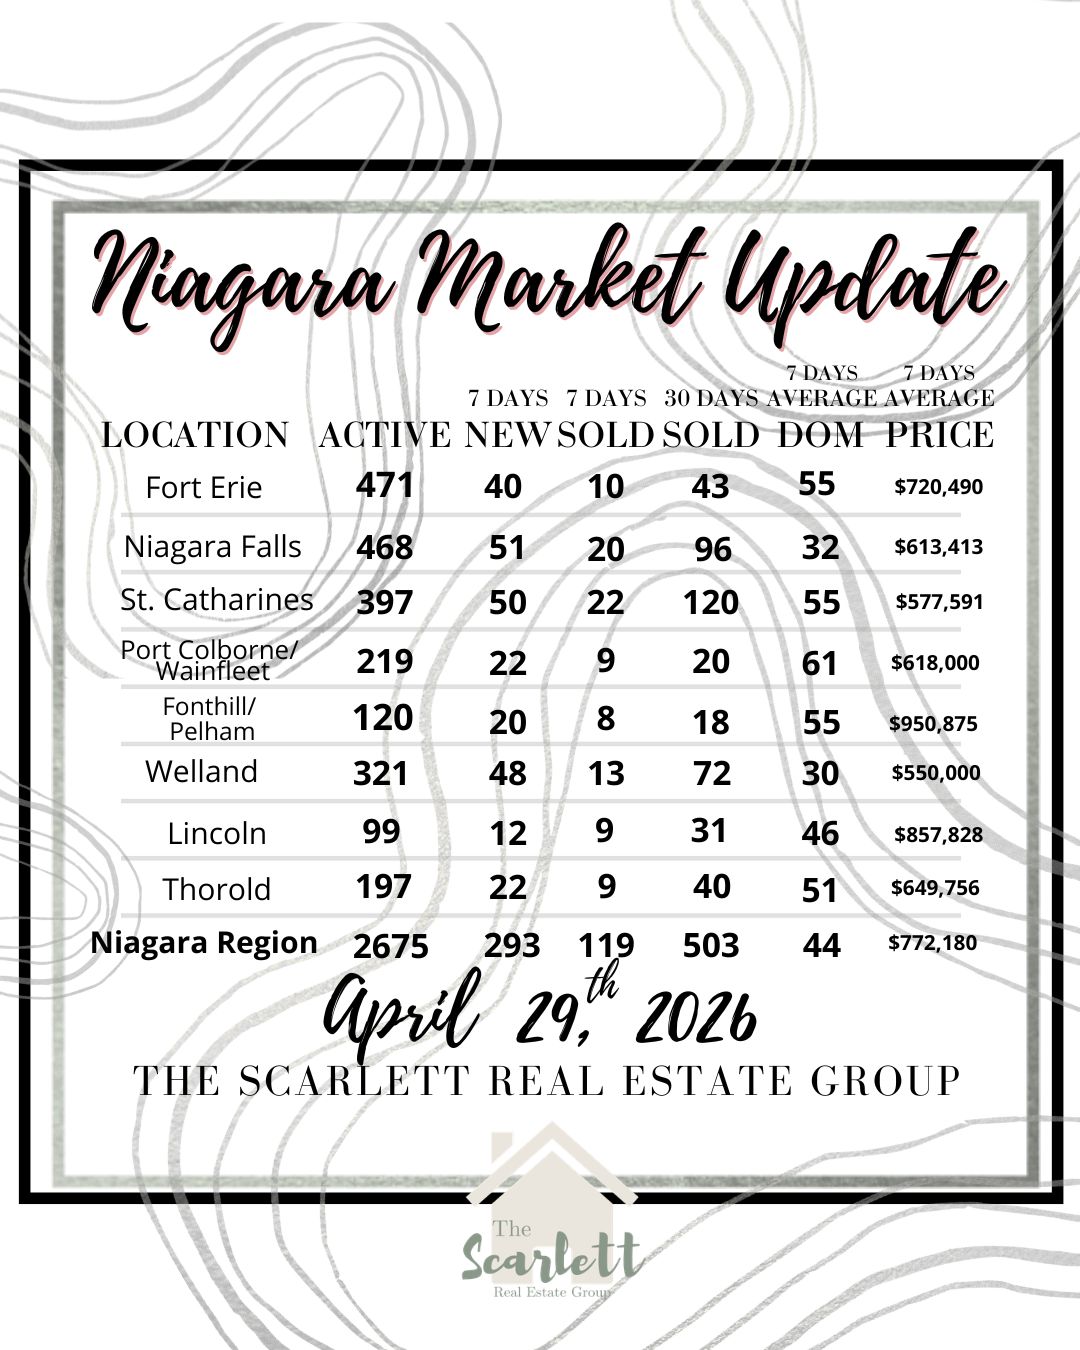
Niagara Real Estate Market Update – April 29, 2026
The latest market data for Niagara Region provides a clear snapshot of current activity levels, pricing, and pace across multiple municipalities. As of April 29, 2026, inventory remains elevated across the region, while sales activity continues to move at a measured pace. The following breakdown reflects the most recent 7-day and 30-day trends, along with average days on market and pricing.
Regional Overview
Across the Niagara Region, there are currently 2,675 active listings and 293 new listings added over the past 7 days. A total of 119 properties sold in the last 7 days, and 503 homes sold over the past 30 days. The average days on market sits at 44, with an average sale price of $772,180.
These figures indicate a steady flow of new inventory entering the market, with consistent sales activity occurring alongside it. The days on market figure reflects the time it is taking for properties to transition from listing to sale, based on recent transactions.
Fort Erie
In Fort Erie, there are 471 active listings and 40 new listings over the past week. Sales activity includes 10 homes sold in the last 7 days and 43 over the past 30 days. The average days on market is 55, and the average sale price is $720,490.
This data shows a moderate level of activity, with inventory levels remaining higher relative to the pace of sales. The days on market figure indicates the average time required for properties to sell in current conditions.
Niagara Falls
Niagara Falls reports 468 active listings and 51 new listings in the last 7 days. There were 20 sales in the past week and 96 over the last 30 days. The average days on market is 32, with an average price of $613,413.
Compared to other areas, Niagara Falls shows a shorter average time on market, suggesting that properties are selling more quickly relative to other municipalities in the region.
St. Catharines
In St. Catharines, there are 397 active listings and 50 new listings. Sales include 22 homes in the last 7 days and 120 over the past 30 days. The average days on market is 55, and the average price is $577,591.
This reflects a balanced level of inventory and transaction volume, with a steady flow of both new listings and completed sales.
Port Colborne / Wainfleet
The Port Colborne and Wainfleet area shows 219 active listings and 22 new listings over the past week. There were 9 sales in the last 7 days and 20 in the past 30 days. The average days on market is 61, with an average price of $618,000.
The longer days on market indicates that properties are taking more time to sell compared to other areas within the region.
Fonthill / Pelham
In Fonthill and Pelham, there are 120 active listings and 20 new listings. Sales include 8 in the last 7 days and 18 over the past 30 days. The average days on market is 55, and the average sale price is $950,875.
This area continues to reflect a higher average price point relative to other municipalities in Niagara.
Welland
Welland currently has 321 active listings and 48 new listings. There were 13 homes sold in the past 7 days and 72 over the past 30 days. The average days on market is 30, with an average price of $550,000.
The lower days on market suggests that homes are selling more quickly in this area compared to several others across the region.
Lincoln
In Lincoln, there are 99 active listings and 12 new listings. Sales activity includes 9 homes sold in the last 7 days and 31 over the past 30 days. The average days on market is 46, and the average price is $857,828.
This reflects a smaller inventory pool with steady transaction levels.
Thorold
Thorold shows 197 active listings and 22 new listings over the past week. There were 9 sales in the last 7 days and 40 over the past 30 days. The average days on market is 51, with an average price of $649,756.
The data indicates a moderate pace of activity with inventory levels supporting ongoing transactions.
Summary
The Niagara Region market as of late April 2026 continues to show elevated inventory levels alongside consistent sales activity. Days on market vary by municipality, ranging from 30 days in Welland to over 60 days in Port Colborne and Wainfleet. Pricing also varies across the region, with higher averages in areas such as Fonthill/Pelham and Lincoln, and lower averages in markets like Welland and Niagara Falls.
This data provides a current view of listing activity, absorption, and pricing across Niagara, based strictly on the most recent 7-day and 30-day reporting periods.